ContentsPerformance curves
Performance curves
Define a data series for a table, type each record's curve points, and let calculated lines draw themselves from the record's values.
One number can't describe how a pump performs across its range; a curve can. You describe the kind of curve once for a table, each record gets its own points, and charts, spec sheets and the portal draw them. Curves you can work out draw themselves on every record.
This guide defines a head–capacity series, types one pump's curve, then adds a calculated line.
Series, curves and calculated lines
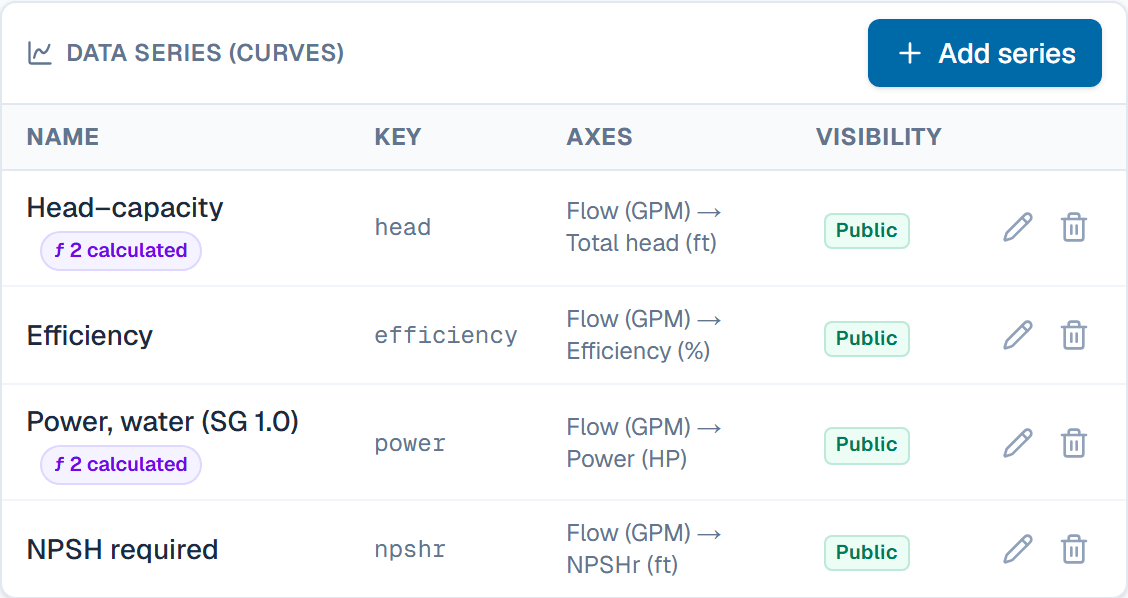
- A series is the kind of curve a table's records carry, such as Head–capacity: two axes, each with a label and a unit, and a tier.
- A curve is one set of points on one record, under a label such as Maximum impeller. A record can hold several per series, such as one per speed.
- A calculated line is a curve SpecLatch draws on every record, from that record's values or from one of its typed curves. Nobody types its points.
Points are stored in the series' units, so the axis units lock once any record holds typed points: changing them would rescale every curve.
Before you start
- Defining a series takes the Admin role, or Engineering with Confidential visibility. Typing points takes Admin or Engineering.
Define the series
- Open Fields and pick the pump table.
- Under Data series (curves), click Add series.
- Type the name Head–capacity; the key fills in.
- Under X axis, type the label Flow and pick the unit GPM.
- Under Y axis, type the label Total head and pick ft.
- Under Visibility, pick who sees the curves. New series start as Internal.
- Click Create series.
Type a record's curve
- Open a Draft record of the pump table.
- In its Curves section, click Edit curves. On a record you can't edit, the link reads View curves.
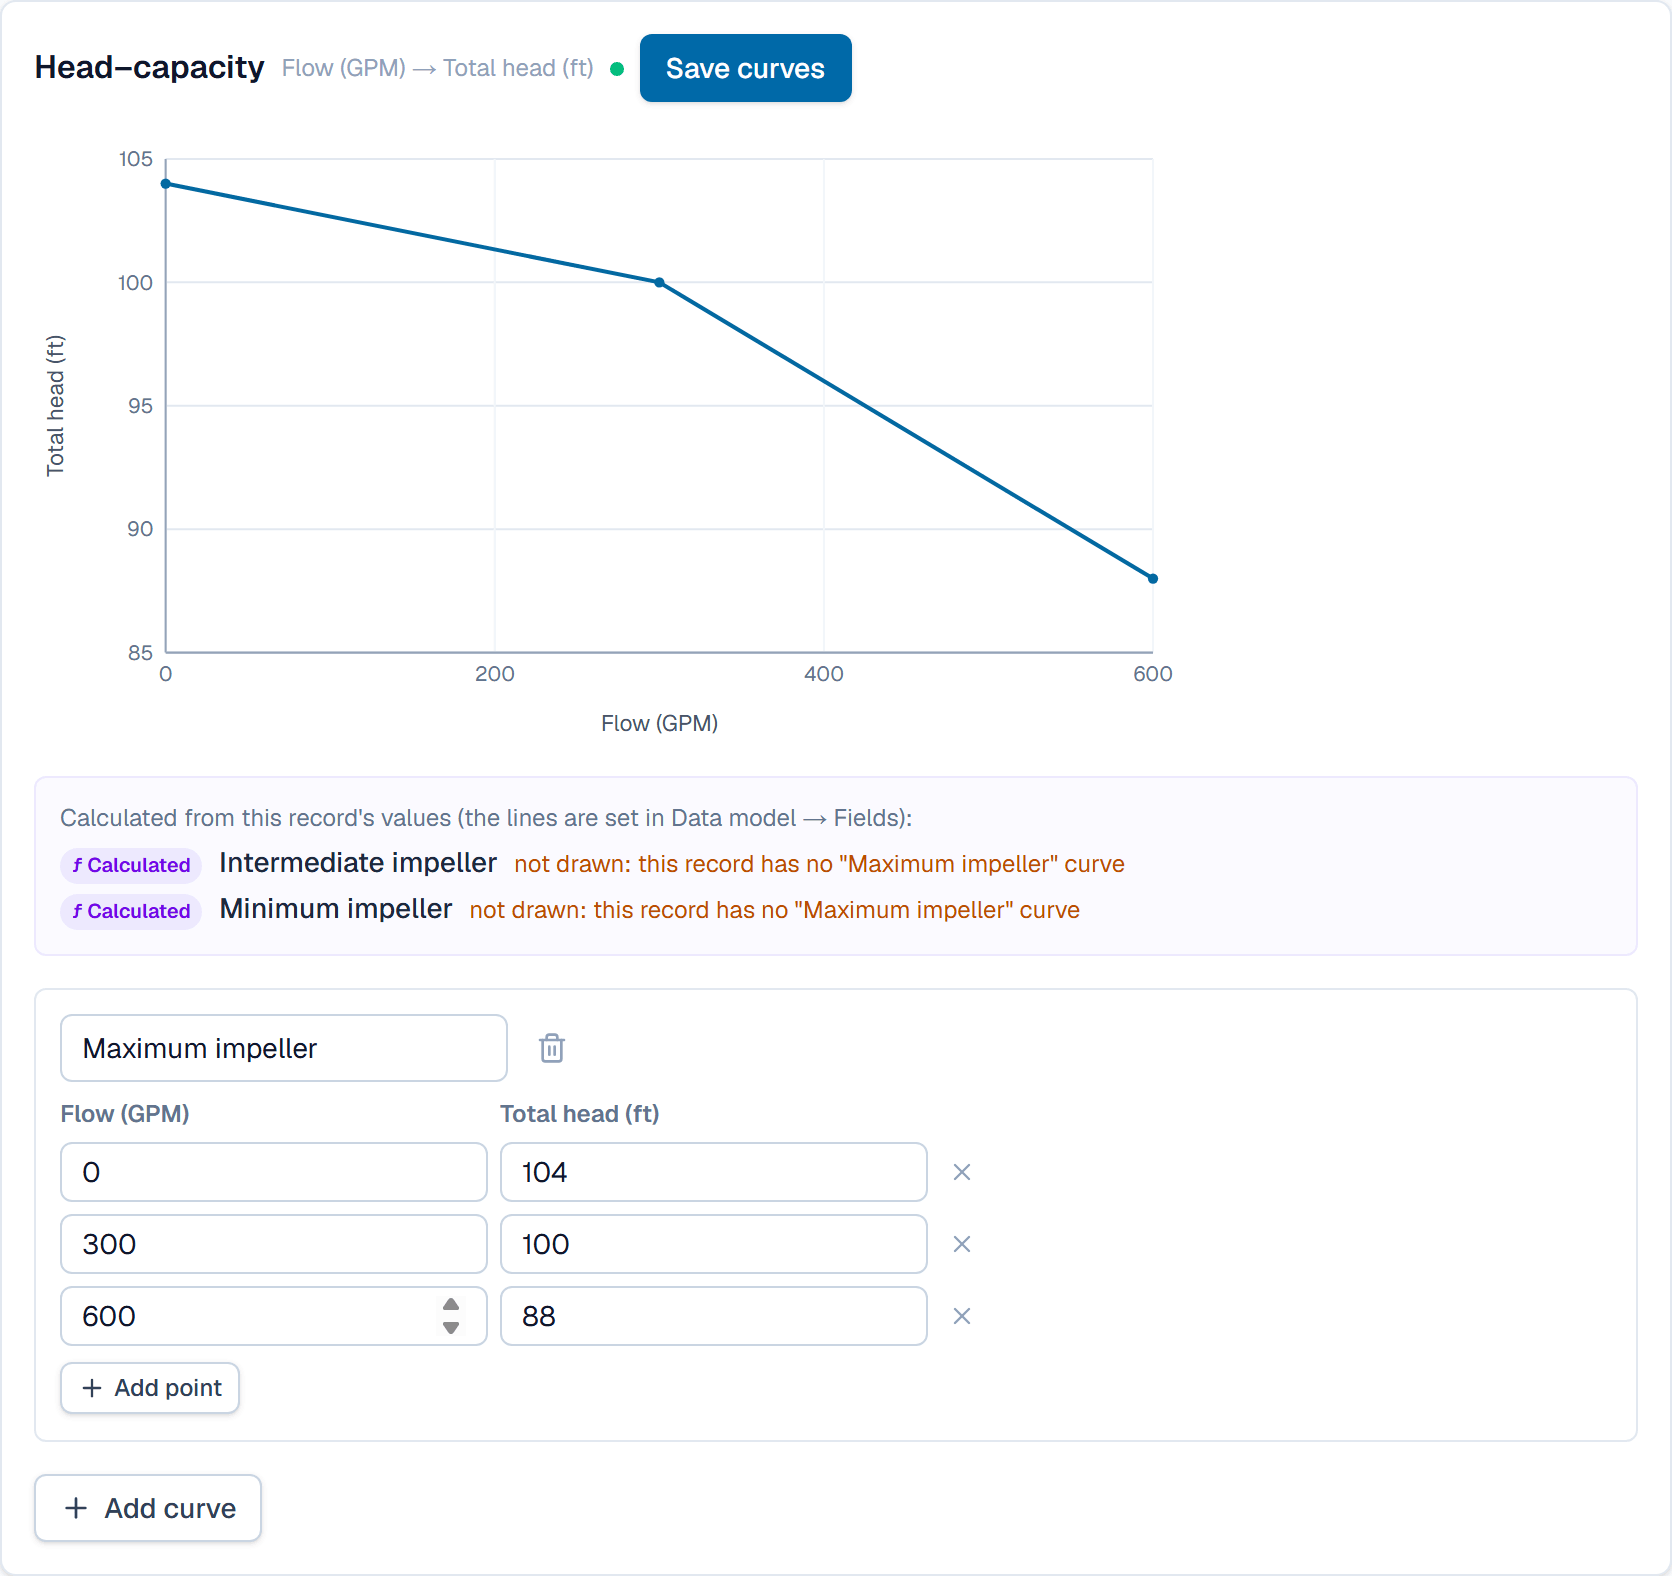
- In the Head–capacity box, click Add curve.
- Type the label Maximum impeller.
- Type the first point in the units shown above the columns: Flow = 0, Total head = 104.
- Click Add point and type the next one, such as Flow = 300, Total head = 100. The chart redraws as you type.
- Click Save curves.
Draw a calculated line
A line has two ways to get its points:
- Formula of x: y is a formula of x and the record's fields. x runs evenly between two values, through a list, or through a reference table's rows.
- From another curve: each point of a typed curve on the same record maps to a new point, through one formula for x and one for y. Smaller impellers can come from the maximum impeller curve this way.
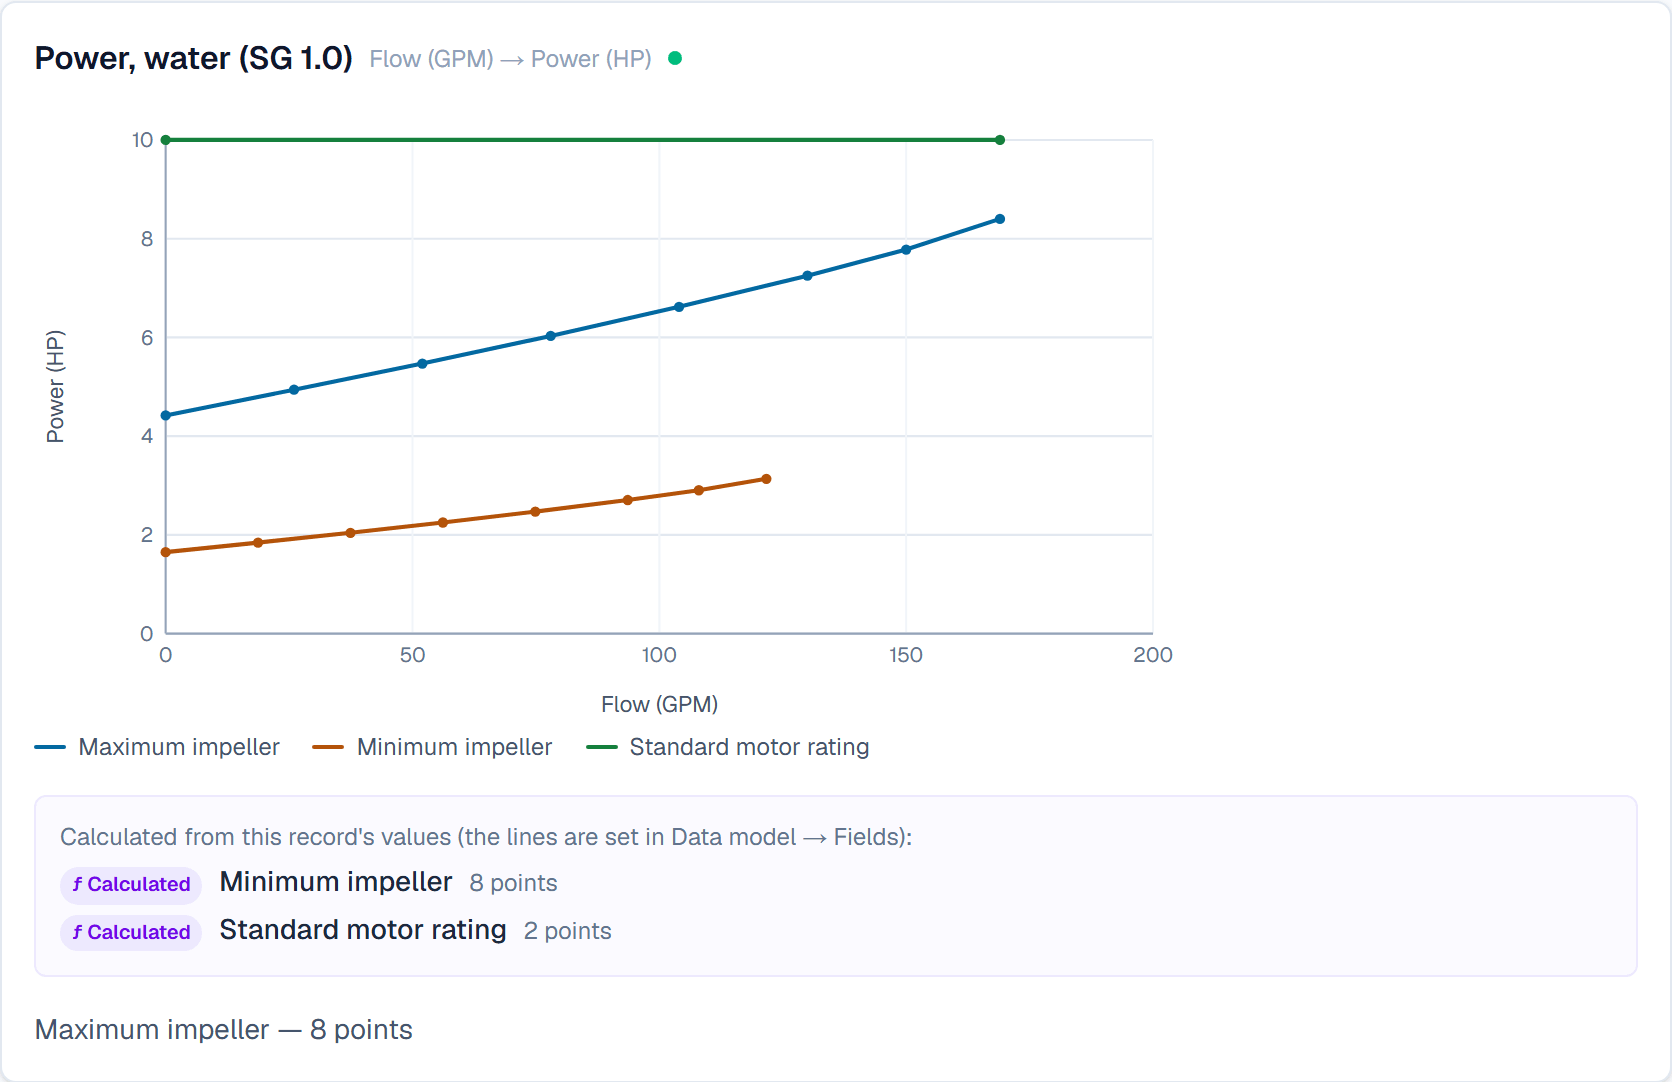
The example draws the standard motor's rating as a flat line on a power series, so the chart shows whether the pump stays under it.
- On Fields, click Edit series on the power series' row.
- Under Calculated lines, click Add line.
- Type the label Standard motor rating and keep Formula of x.
- Set x runs to evenly from … to …, and fill in from
0tomax_flowin2points. - After y =, type
std_motor_hp, the motor's rating looked up from the linked motor. - When Lines check out shows, click Preview on records to check a few records.
- Click Save changes. Every record in the table draws the line.
On a pump with max_flow = 169 GPM and a 10 HP standard motor, the line runs flat at 10 HP from 0 to 169 GPM.
What happens after
Calculated curves redraw whenever the record's values change. Members whose visibility is below the series' tier don't see it, and the portal shows only Public series. When an Engineering member saves calculated lines, the series can't be more visible than the fields they read.
Related
| Concept | Units & formulas |
| How-to | Define a reusable function |
| How-to | Set a field's confidentiality tier |
| Concept | Records & the grid |