Performance curves
Performance curves, stored as data
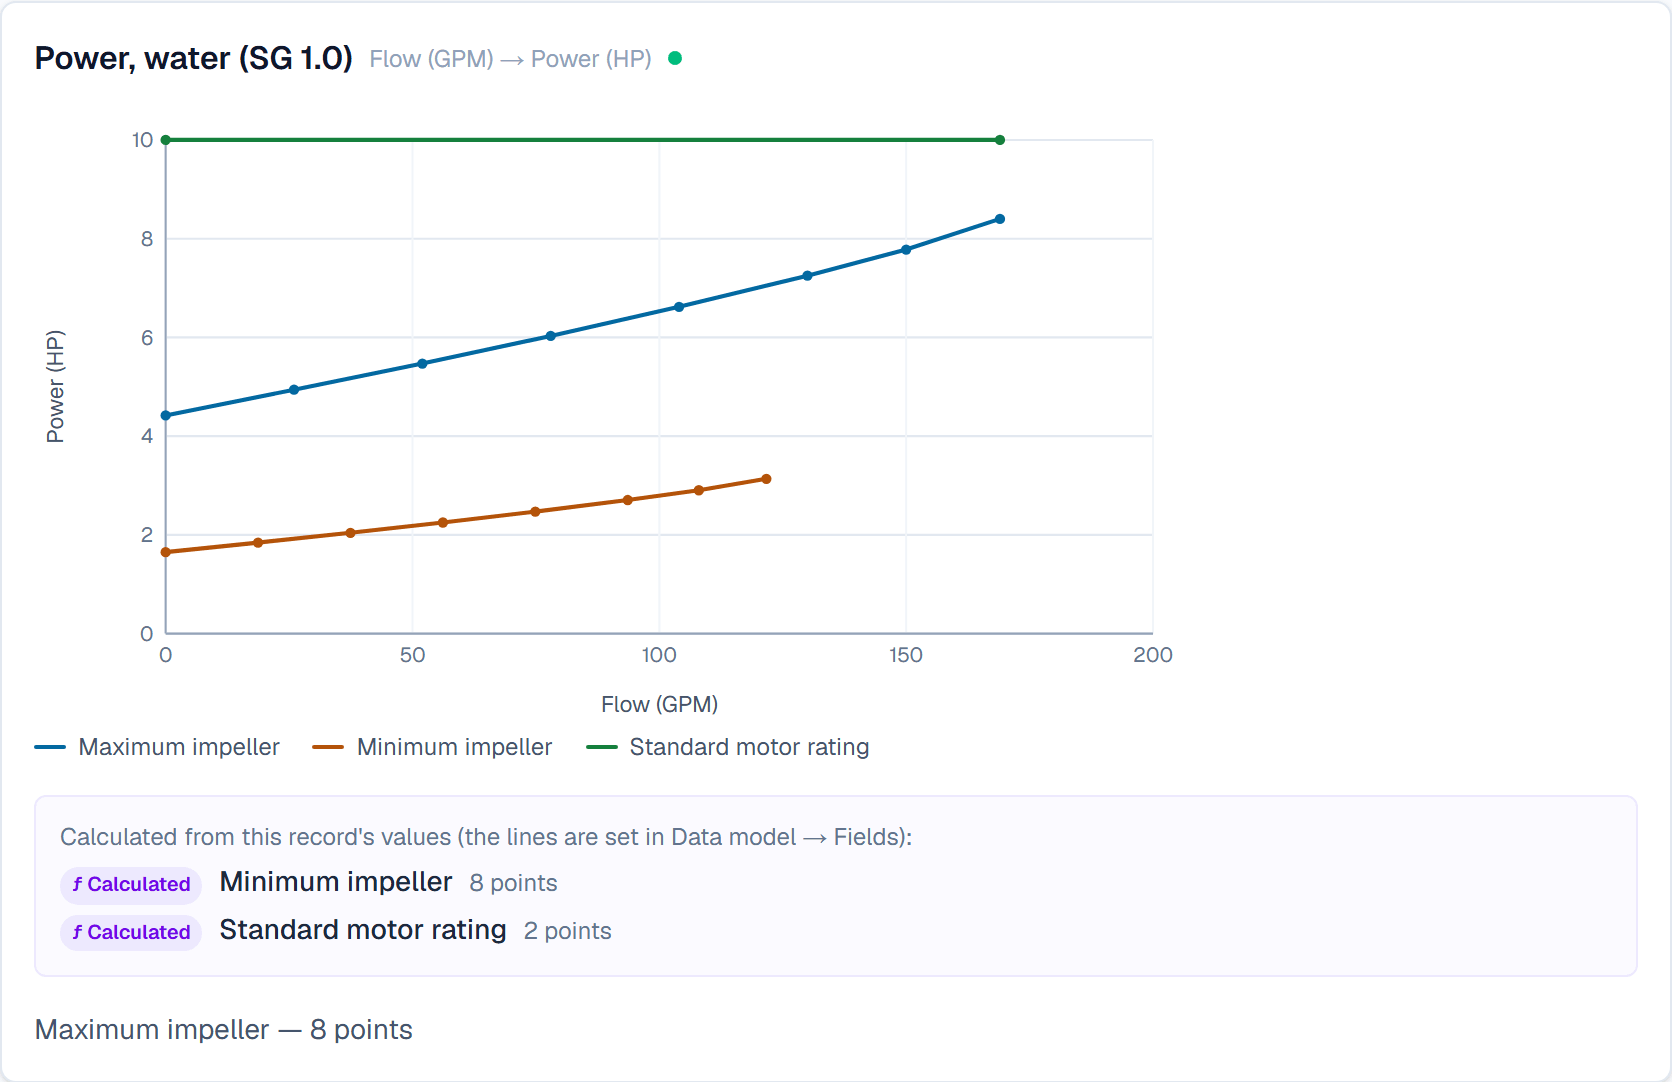
Type or paste a curve's points once. SpecLatch draws it to scale wherever the record goes, and can add lines worked out from the record's own values: from a formula, from a reference table, or from another curve. In the chart below, two of the three lines are calculated. Change the trim and they redraw.
HC 2x1.5-6 · Head–capacity at 3,500 RPM
- Maximum impeller6-1/4 in · 159 mmTyped: eight tested points
- Intermediate impeller5-3/8 in · 137 mmCalculated
- Minimum impeller4-1/2 in · 114 mmCalculated
4-1/2 in · 114 mm
A field on the record. The two dashed lines read it: at this trim the smallest impeller turns 0.72 of the full diameter, so it gives 0.72 of the flow and 0.52 of the head.
Calculated lines
Intermediate impeller
From another curve: Maximum impeller
new x =
trim_flow(x, (impeller_min + impeller_max) / 2 / impeller_max)new y =trim_head(y, (impeller_min + impeller_max) / 2 / impeller_max)Minimum impeller
From another curve: Maximum impeller
new x =
trim_flow(x, impeller_min / impeller_max)new y =trim_head(y, impeller_min / impeller_max)
Your functions
- q·r
trim_flow(q, r)
- h·r2
trim_head(h, r)
Drawn in your browser by the same curve code the app runs, from one record of the demo catalog.
A curve type, set once per table
A curve type names the two axes and their units: head against flow, torque against speed, pressure drop against flow. Every record in the table then carries its own points, and a record can hold several labelled curves of the same type, one per supply pressure or per size.
- Unit-aware axes, defined once for the whole table
- Paste the points from a spreadsheet
- Several curve types per table
Calculated lines
A line can be computed where typing it would be busywork. Give y as a formula of x, run x through the rows of a reference table, or map every point of a typed curve to a new one. The formulas read the record's fields and call your own functions, and the line redraws when a value changes.
- From a formula, a reference table, or another curve
- Each record draws its own line from its own values
- A line that cannot be drawn says which input is blank
Both unit systems on the axes
The points are stored once, in the axis units you chose. A chart can show them in the other system without a second copy: the same curve, with metric gridlines. On the public portal the visitor's Units panel applies to the charts as it does to the spec table.
- Imperial or metric from the same points
- Gridlines land on round values in either system
- The curve keeps its shape; only the scale changes
Wherever the record goes
Curves are part of the record. They show on its page, print on spec sheets and catalogs, appear on the portal's product page, and come out of the API as points, with calculated lines marked as such. Each curve type has a confidentiality tier, so an internal test curve stays internal.
- A Curves element in the document designer
- Points over the API, calculated lines flagged
- A confidentiality tier per curve type
Learn it in the guide
Curves, from typed points to calculated lines
- Performance curvesDefine a data series for a table, type each record's curve points, and let calculated lines draw themselves from the record's values.Read it · 8 min
- How formulas workField keys and operators, unit checks, temperatures, tests and choices, linked records, reference tables, your own functions and curves, each with an example.Read it · 12 min
See it speaking your industry's language
See it on your own catalog
Start a free trial and import one of your own product families. The fastest way to evaluate SpecLatch is on your own data.
30 days of Growth-plan features · no credit card required · your data exports any time